Which tool is my favorite for quantitative data analysis?
It’s called Julius AI.
It will analyze your data in 10 seconds.
This tool is used by more than 500,000 researchers.
𝐖𝐡𝐚𝐭 𝐜𝐚𝐧 𝐲𝐨𝐮 𝐝𝐨 𝐰𝐢𝐭𝐡 𝐉𝐮𝐥𝐢𝐮𝐬 𝐀𝐈?
➟ Draw all kinds of graphs based on your data
➟ Clean your data
➟ Run significance test on your data
➟ Explore trends and relationships in your data
➟ Convert tables in PDF to excel format for analysis
➟ Perform multivariable analysis of your data.
Ever felt overwhelmed by quantitative or qualitative research tools?
You’re not alone!
Choosing the right tool can feel like navigating a maze.
This guide will make the journey easier.
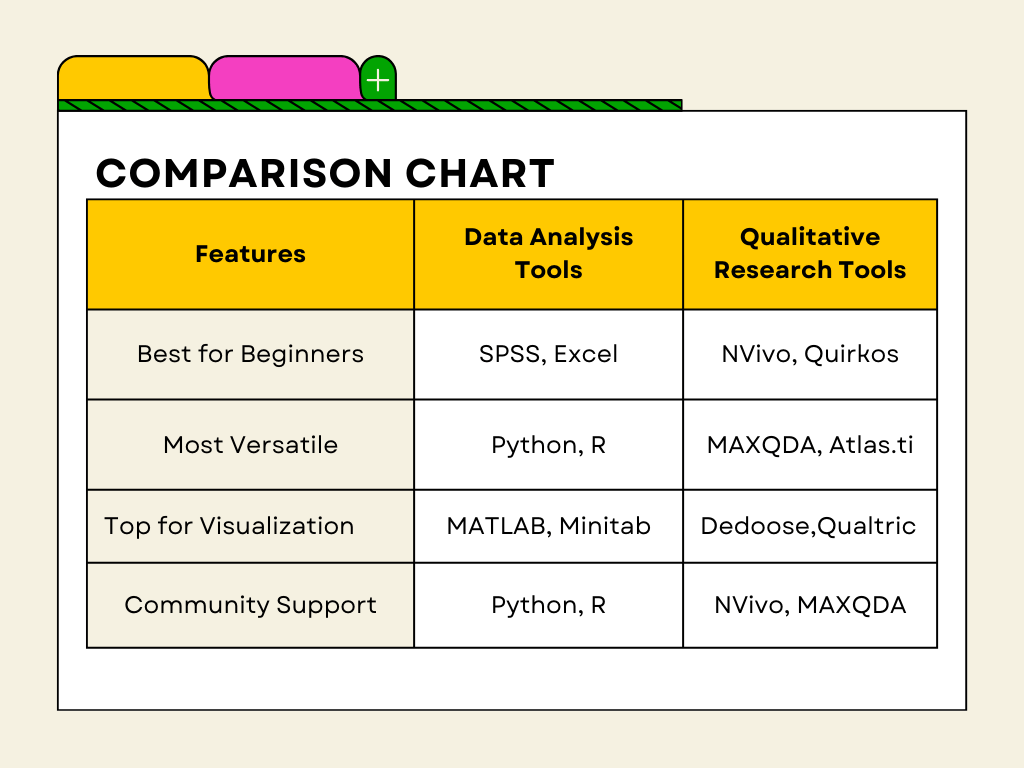
Quantitative and qualitative research often feel like two separate worlds, but both are essential for a well-rounded PhD journey. This week, I’m sharing a breakdown of the top 10 tools for each type of research. Let’s dive in!
Top 10 Tools for Quantitative Research
1 SPSS : Widely used for statistical analysis in social sciences.
Pro Tip: Use the built-in tutorials to quickly learn essential functions and save time!
2. R: A flexible, open-source programming language for statistical computing and graphics.
Pro Tip: The tidy verse package simplifies data wrangling for R beginners.
3. SAS: Known for advanced analytics, business intelligence, and data management.
Pro Tip: SAS has a wide range of free resources to get started, including video tutorials.
4. STATA: User-friendly and widely used in social sciences and economics for its statistical capabilities.
Pro Tip: Stata’s built-in documentation is incredibly detailed—perfect for beginners.
5. Python (Pandas, NumPy, Matplotlib): Powerful libraries for data manipulation and analysis.
Pro Tip: Check out seaborn for making beautiful statistical plots with minimal effort.
6. MATLAB: Great for technical computing, with strong visualization capabilities.
Pro Tip: Explore the plotting features to create visuals that make data storytelling easier.
7. MS Excel: Known for basic data analysis, but advanced users can utilize its powerful features.
Pro Tip: Master pivot tables to summarize large datasets quickly.
8. SPSS Modeler: Designed for data mining and predictive analytics.
Pro Tip: Use SPSS Modeler’s “predictive” features to explore future trends in your data.
9. Minitab: Ideal for statistical analysis and creating clear visuals for data interpretation.
Pro Tip: Use the built-in chart templates to save time and ensure consistency.
10. Julius AI: Widely used for general purpose quantitative data analysis.
Pro Tip: First try it’s free version and you will be amazed by the value Julius AI brings.
Top 10 Tools for Qualitative Research
1 NVivo: Organizes and analyzes text, audio, video, and images.
Pro Tip: Organize your codes hierarchically to streamline analysis for large datasets.
2. MAXQDA: Offers coding and visualization for qualitative and mixed-methods research.
Pro Tip: Use the MAXMaps feature to create visual networks of your coded data.
3. Qualtrics: A robust survey platform that allows researchers to collect and analyze qualitative responses.
Pro Tip: Use branching logic to make surveys more dynamic and tailored to respondents.
4. LiGRE: Cloud-based for collaboration, supporting transcription and coding of multimedia data.
Pro Tip: Take advantage of LiGRE’s real-time collaboration features for team projects.
5. Quirkos: An intuitive visual tool for coding and exploring qualitative data.
Pro Tip: Quirkos’s bubble interface makes it easy to spot themes at a glance.
6. HubSpot: Provides survey and feedback tools for qualitative data collection and organization.
Pro Tip: Use the free tools for small-scale projects or feedback loops.
7. Square Feedback: Facilitates qualitative feedback collection on designs and user experiences.
Pro Tip: Use Square Feedback’s comment feature to track evolving ideas on user experience.
8. Atlas.ti: Manages and analyzes textual, audio, visual, and video data.
Pro Tip: Use network views to visually map out relationships in your data.
9. Transana: Focuses on transcribing, coding, and analyzing audio and video data.
Pro Tip: Transana’s split-screen view is a lifesaver for analyzing visual and audio simultaneously.
10. Raven’s Eye: Great for unstructured text data, such as interview transcripts and open-ended survey responses.
Pro Tip: Use the sentiment analysis feature to gauge emotional trends in your data.

Data Analysis
Open a sample dataset in Julius AI or Python and try generating a simple scatter plot.
Action Step for the Week
Pick one quantitative and one qualitative tool from the lists above to explore further.
Let me know in the comments which tools you’re planning to try, or if you have any questions!
With the right tools in your toolkit, both quantitative and qualitative research can become much more manageable.

Thanks Dr faheem ullah for sharing. Yesterday i had attended your webinar which was also so informative for fresh researcher for conducting their literature review.
It was very informative and helpful. Thank you.